Student’s t-distribution
Introduction
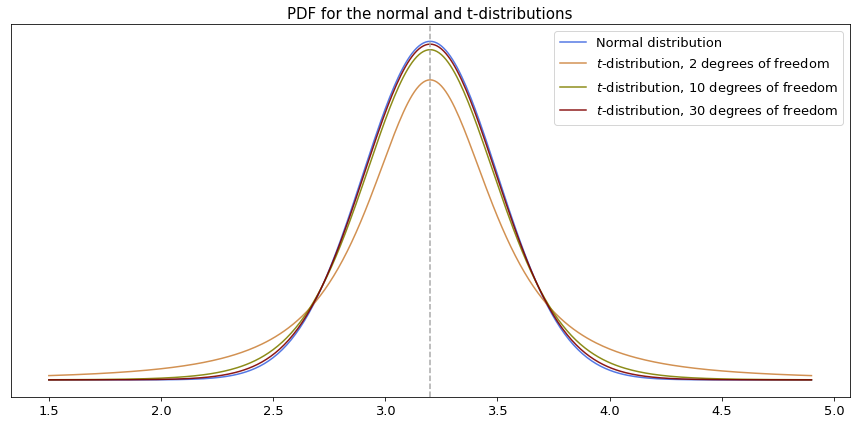
The Student’s t-distribution is a continuous probability distribution that is very similar in shape to the normal distribution. However, it is specifically designed for situations where the sample size is small and the population standard deviation is unknown. Its most distinguishing feature is its fatter tails, which account for the greater uncertainty that comes from working with a small sample of data.
Unlike the normal distribution, which has a constant shape, the shape of the t-distribution changes based on a single parameter: the degrees of freedom ($\nu$).
Properties
-
Degrees of Freedom ($nu$): This parameter is directly related to the sample size (n). The degrees of freedom are calculated as n−1.
-
Fatter Tails: The “fatter tails” mean that the t-distribution assigns a higher probability to extreme values compared to the normal distribution. This reflects the reality that with a small sample, you are more likely to encounter an extreme value by chance.
The key property of this distribution is its relationship with the normal distribution. As the degrees of freedom increase (i.e., as the sample size grows), the t-distribution’s shape becomes virtually identical to the standard normal distribution.

As the size of the sample (and therefore the degrees of freedom) increases, the t-distribution becomes virtually identical to the normal distribution. For a sample size of roughly 30 or more, the two distributions are so close that they can be used interchangeably.
Why Is It So Important?
The t-distribution is a cornerstone of inferential statistics because it provides a reliable method for analyzing data from small samples.
Its primary use is in:
-
Hypothesis Testing: It is used in the t-test to determine if the means of two groups are significantly different from each other when the sample size is small and the population variance is unknown.
-
Confidence Intervals: It is used to construct confidence intervals for a population mean. This allows us to estimate a range of plausible values for the true population mean based on a small sample.
In essence, while the normal distribution is the “ideal” model for a large population, the t-distribution is the practical and more robust tool for when we have limited data.
Using t-distirbution
T-table
Similar to how z-scores and z-tables are used for the normal distribution, the t-distribution has its own tables of precomputed values for different levels of degrees of freedom. This is incredibly useful for practical applications, as it means there is no need to perform complex integration over its probability density function when calculating probabilities.